Test Window
The Misura™ Test Window opens in Browser’s tabs once a test has been selected.
Its appearance is very similar to the Live Acquisition window, with a central area displaying a plot and a lateral area showing test configurations and data Navigator.
The values contained in the configuration tabs (Measure, Sample 0…n, Thermal Cycle) are the ones recorded at the end of the test.
Basic Plotting and Embedding
At the opening of the test, a standard plot is displayed. In order to interact with this plot, switch to Results tab in the left panel.
You can operate on the plot with the usual Navigator functions (un/plotting a curve, smoothing, deriving, etc). You can also create a test report on a new plot page.
Once you are satisfied by your plot, you can permanently save into the test file.
- From
Measuremenu, click onPlotssubmenu. - Select
Save new plot. Give a name to your plot. - Your new plot will appear in the
Plotssubmenu.
Saved plots can be recalled, overwriting any current plot.
Re-calculate metadata
The logic by which characteristic or important points are identified during the test is saved onto the test file. Through the Browser it is possible to change and replay this logic, for research purposes.
The replay is accessible from the Measure menu, at the Re-calculate metadata action. All affected values will be recalculated. If the target value is unchanged, refresh it by hovering with the mouse.
Versioning
The original data cannot be modified or removed from a test file.
A versioning mechanism allows to change any configuration option and any metadata and save everything in a new test version. Multiple versions can be saved in each test file.
Multiple plots can also be saved under the version that generated them and recalled.
Versioning allows, for example, to correct the test name, or add a comment, or manually edit characteristic shapes. To save a new version, starting from a file containing only the original data:
- Do your changes to any configuration option
- Click on menu
- A dialog box will ask the label of the new version.
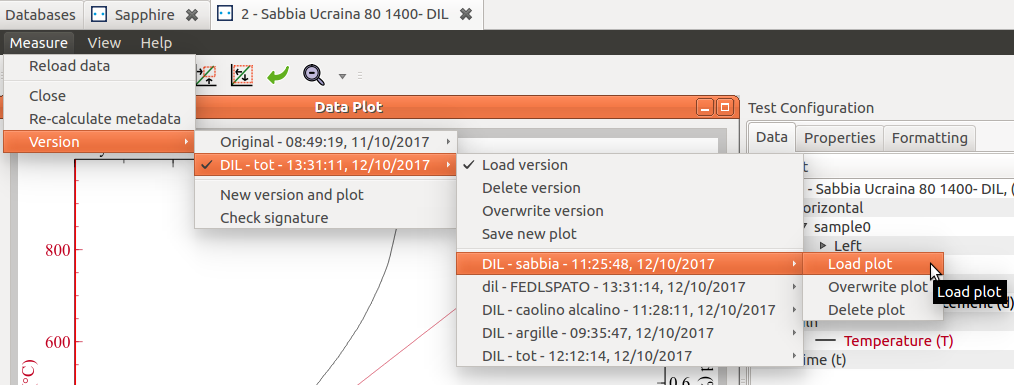
After a new version is created, the Version menu will show an additional, checked sub-menu below the Original one. The version submenu allows to:
Load version: reload the configuration options from the parent version. This menu action is checked in the current version.Delete version: remove the parent version and any associated plot.Overwrite version: overwrite saved configuration.Save new plot: save current plot as a new plot associated to the current version, with a new name.
The Original version cannot be overwritten nor deleted, and only displays the Load version action.
Below these version-submenu actions, all associated plots are listed as sub-menu. Each plot-submenu has three entries:
Load plot: loads the selected plot. If the plot pertain to a version which is not current, the parent version will be loaded instead.- The current plot will be deleted and replaced with the loaded one. By hovering the mouse over the load action, a preview of the plot will pop-up.
Overwrite plot: overwrite that plot.Delete plot: delete that plot.