Live Acquisition
The Live Acquisition software allows to carry on any kind of measurement available on a Misura platform.
This section describes basic concepts, functionalities and procedures which are general enough to be applicable to any measurement.
More specific instructions can be found in Measurement Apps sections dedicated to each instrument.
Connecting
When you first launch Acquisition software, you have to select a server to connect to.
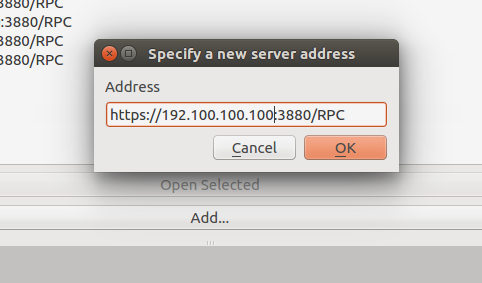
Select the action. Alternatively, from the Recent Servers area, click the Add button:

An input dialog will let you specify the server protocol, IP, port and path. In a normal environment, the server address will be:
A username and a password will be prompted, and saved for any future connection to that machine.
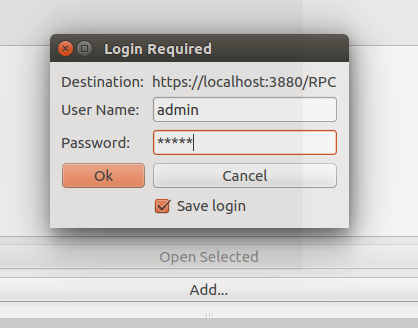
Saved connections will be displayed both as items in the Recent servers box on the welcome page of Live Acquisition, and as menu items.
Client network configuration
You should connect to the instrument through a crossover cable or a private hub just between the client PC and the instrument network interface.
As the instrument provides no network auto-configuration, you will be required to manually set-up your network interface in order to be able to reach that IP.
Factory-installed clients usually have this configuration:
- IP: 192.100.100.2
- Netmask: 255.255.255.0
- Gateway and DNS: None
Follow this official guide for Windows to disable DHCP and manually set a fixed address.
Time synchronization
The time between instrument and client computer is kept synchronized. The user may periodically see a warning message upon connection, asking to re-synchronize times. If replied positively, the instrument will restart for synchronization.
It’s up to the user keep the client’s computer time up-to-date, manually or by using exact time services.
When connecting from multiple clients, you should keep all client synchronized at the same time, to avoid multiple re-sync.
Initializing the Measurement App
After a successful connection you will be shown a list with available Measurement Apps, a button for each instrument. Click the corresponding button to select your desired instrument.
Once the instrument is selected, the machine will start its setup, also called measurement morphing. A “Pending Tasks” dialog will appear in the left panel, showing some details about what is happening. The internal positions of measuring components will change in order to reach the configuration required to perform the requested instrument, as displayed in this video.
This operation can take up to a couple of minutes, depending on the instrument. Any interaction with the application is discouraged until when the dialog disappears.
Once the initialization is complete, the application will display all relevant controls needed to configure, start and follow the execution of the test.
- The menu bar contains:
- Connect: to connect to a different machine or to change measurement app.
- Measure: allows to re-initialize the instrument from zero, set a delayed start, hide/show user interface components (Test Configuration, Storyboard, Data Plot, Data Table, Log Window), Reload Data from the instrument, Quit client.
- Settings: gives access to advanced configuration panels for the Instrument itself, its individual Devices, or the full Global configuration.
- View: Hide/show user interface components, like plot window, storyboard, etc.
- Help: client configuration, documentation link opening the documentation you are reading, the Pending Tasks dialog, the software information dialog.
- On the right side of the window you find a tabbed Test Configuration area, showing:
- Status tab: contains short summary of the current test condition. The first two options shows if a test is running (data recording) and if the thermal control is active. They are underlined in green when not active, in red when running. Then follows information on test name and test duration (if running); the furnace position if motorized; temperatures, setpoint and power output. More sample-dependent option can be shown based on the active measurement app.
- Measure tab: generic test configurations can be made (starting and stopping conditions) and metadata can be viewed (eg: maximum temperature reached)
- Thermal Cycle tab: allows to define the thermal cycle and preview it
- Sample<N> tabs: one tab for each sample defined in the analysis.
- Results tab: empty until the start of the test. Will be populated with tools for Interacting with a running test.
- On the bottom, a bar showing:
- Focus slider and spin-box, to adjust the focus distance.
- Furnace: option to view and control furnace position (Opened/Closed). Only available if furance is motorized.
Configuring the test
The following paragraphs explain common procedures or concepts needed to carry out any test with Misura™.
Moving the furnace
The first step of test configuration is placing the sample in the right position. If the furnace is motorized, you should always open it by using the option Is the furnace closed? in the Status tab, or the Furnace: box in the bottom bar. That option should be changed to the desired position: Closed or Opened.
Once the sample is positioned and correctly framed, it is advisable to close the furnace using the same option, and proceed with test configuration.
Measure and Sample names
The test name can be directly set in the Status panel, or in the Measure tab.
This is the name of your measurement, but the sample (and each sample) can have a different name. Sample names can be set in their Sample<N> tab, in Name option (see Samples).
The test name should identify the kind of measurement, while the sample name should identify the material the measurement method is applied to. You will be able to recall the both test name and sample name from the Database Indexes.
For simplicity you can just set the test name to a string identifying both the kind of test and the sample name, and leave the sample name field to the default value (Sample N. 0).
The test name will also be used as the output file name. If a file with the same name already exists, it will be postfixed with _<N>, where <N> will be increased until an unique name exists (measure, measure_1, measure_2, etc).
Thermal cycle
The Thermal Cycle tab in the Test Configuration area allows to load a thermal cycle preset or to design a new one. Refer to Thermal Cycle Designer for a detailed explanation.
Additional test termination options can be configured in the Measure and Sample sections, depending on the Measurement Apps you are using.
Measure
This tab contains:
- Configuration preset: a combo that allows you to load a previously saved configuration. Save and Del buttons respectively save and delete currently selected preset.
- Name: the name to give to the test.
- Maximum test duration: defines the amount of passed time that will cause the end of the test, even if the thermal cycle is not completed (-1 removes this timeout)
- Stop after thermal cycle: when set, the acquisition will stop when the thermal cycle is over. If not set, the acquisition will go on until the operator won’t stop it manually.
- Operator: the operator running the test
- Type: the type of test. Only Standard is supported to date
- Start at: date and time when the test was started
- Number of samples: sets the number of samples to analyze (can be from 1 to 8)
- Kiln position before acquisition: the position where the kiln will be placed right before the start of the acquisition
- Kiln position after acquisition: the position where the kiln will be placed after the end of the acquisition
- End status: displays the reason of the acquisition’s termination
Samples
Every sample has its own tab, named Sample0, Sample1, …
Each tab contains the details of its sample:
- Configuration preset is the currentrly loaded preset. You can change it, save it if you make any change, and delete it.
- Name is the name of the sample
- Temperature is the current sample temperature
- Initial sample dimension is the size of the specimen, before the start of the test
- Record frames defines wether tha raw frame of the sample should be saved or not
- Record profiles defines wether the sample profiles have to be saved or not
- Border angle is the angle of currently detected border
- Total displacement is the current displacement from initial position
Starting/stopping the test
Once the test is completely configured, the sample positioned and the furnace moved to its intended initial position, you can start it by clicking on Start button in the upper-left toolbar. A confirmation dialog will ask you to review the test name, the initial dimension if any, and the system status. By confirming, the test will start.
The button bar in the upper side of the main window has two more buttons, Stop and Cool, as explained in Ending the test.
Delayed start
To schedule a test to start at a specified date in the future, you can use the Delayed start feature, available from the Measure menu.

The Delayed Test Start dialog will appear with the options needed to control its behaviour.
- Enable delayed start: click on the checkbox to engage the delayed start. When the configured time and temperature are reached, the test will automatically start.
- Delayed start date: Set date and time when the test will start.
- Delayed temperature: Set a required minimum temperature for the start of the test. If set to -1, no temperature will be required and only the time delay will be considered.
Then 3 fields allows to understand how and when the test will be started.
- Target instrument: the current instrument app name. It will not be possible to change instrument a delayed start is already configured.
- Remaining time: a countdown showing remaining time to test start
- Operator: the user name of the operator who set the delayed start
Finally, 2 buttons:
- Save and exit: close the client application. The delayed start will remain active and the test will be started at the configured time, even if no client is connected to the instrument.
- Abort delayed start: cancel delayed start and dismiss the dialog.
The dialog will remain active until the test starts. If you close the client application or click Save and exit, the delayed start will remain effective. If you later reconnect to the instrument, the delayed start dialog will pop up again, until test starts or delayed start is aborted.
Dismissing the dialog equals aborting the delayed start.
Interacting with a running test
While the test is running it is possible to perform most of the data visualization and processing operations which are available when accessing to a finished test output file.
- The Status panel tab will update showing relevant options and output values
- By clicking on menu , you can view a realtime graph of output values which will open in a Data Plot subwindow. You can interact with the plot under the Results tab (adding a curve, changing visualization options, etc).
- By clicking on menu , you can inspect all active datasets in a tabular view, which will open in a Data Table subwindow.
- If the instruments records images or sample profiles, the Storyboard will be visible.
Status panel
The Status panel will update showing relevant status, configuration options and real-time output values.
It always contains information about:
- Acquisition status: is there a running test? This coloured checkbox will be False over green background when there is no running test; True over red background while a test is running.
- Thermal control status: is there any running thermal cycle? This coloured checkbox will be False over green background when there is no active thermal control (no thermal cycle); True over red background if the temperature is currently under control by a thermal cycle.
- Test name. This text box is synchronized with the one contained in the Measure tab.
- Elapsed time: Seconds passed since the start of the test.
Thermal control status cannot be True if the acquistion status is False. In other words, temperature cannot be controlled by a thermal cycle outside of a running test.
On the opposite it is possible that the thermal control is turned off during a running test. This happens if the test was set to do not end with the thermal cycle and its target duration was longer than the duration of the thermal cycle. The operator can also manually interrupt the thermal control anytime by pressing the Cool button - without stopping the acquistion (see below Ending the test).
The Status panel also contains real-time thermal control parameters, as:
- Sample temperature: Temperature measured as near as possible the sample, on the sample holder.
- Furnace temperature: Also measured quite near the sample, but attached to the furnace chamber. Thus, if the furnace opens, this thermocouple signal will record the inside of the empty furnace, while the Sample temperature above will record the environment temperature outside of the furnace, nearby to the sample.
- Setpoint: The target temperature of the thermal cycle.
- Power: The percentage of power emitted in order for the control temperature to reach the setpoint temperature.
- Control temperature: The reference temperature used for power emission in order to reach the setpoint. This is usually equal to the Sample temperature while the furnace is closed; to the furnace temperature while it is open; or to a custom combination of both.
Additionally, the Status panel contains realtime values depending on the current Measurement App:
- Initial sample dimension
- Displacement (expansion/contraction/flexion)
- Volume
- Height
- …
Data Plot
The Data Plot is accessible by clicking on menu . It is initialized at the start of the test with a default plot showing the most relevant measured property against time.
The plot can be edited and customized exactly as you would offline using the Misura™ Browser or the Plotting. See Data Plot for more help.
Warning
It is advisable not to build complex plots during live acquisition, as you will loose all your careful work when the test ends. Moreover, complex data operations might slow down the user interface and lead it to a complete freeze, as they are entirely re-computed each time a new data point is received. If this happens, close the Live Acquisition window and reconnect to the running machine. Plotting data has no effect on test execution, measurement, and data collection.
Hint
The data you see during live acquistion is not exactly the same you will find on the output file. This is because the data plot will display raw values as they arrive each couple of seconds. Instead, when you open the output file after the test ended, you will plot slightly smoothed data considering tens of points per second.
Results
The Results tab contains another series of tabs, which are:
- Data Tab: a tree that contains all plottable data to allow you to perform operations over it.
- Properties and Formatting: are the equivalent of Properties and Formatting on the right click menu of the Data Plot. Operations are applied on the object selected in the Objects tab or on the plot.
- Objects is a 1 to 1 representation of the plot; it allows to select objects to perform operations in other contexts.
- Console is the Veusz output console.
Data Table
The Data table is accessible by clicking on menu . It displays one column for each Loaded Dataset.
New data points are dynamically added at the end of the table. The table can be exported to *.csv file format anytime by right-clicking on the header.
Storyboard
The storyboard displays a list of recorded frames or profiles of a sample. The target sample can be changed with the upper-left combo box.
The storyboard is available only when images or profiles are saved in the output file. Frame and profile recording can be configured, before test start, in the Sample <N> tabs in Test Configuration panel.
It is always visible in the Microscope app. If not, it can be accessed by clicking on menu .
A label below each image reports the temperature value at which the image was recorded (eg: T: 321).
More measured values can be displayed by dragging and dropping nodes from the Results tab.
The number of images is fixed (usually five on an horizontal row).
The user can navigate forward and backward by using the upper slide bar, which will cause the images to update to the recorded data in the position indicated by the slider, relative to total test duration.
Navigating through the images will cause a vertical red line to move back and forth in the Data Plot, if visible. The operator can thus view measured values associated with displayed images.
It is possible to navigate through the images also by dragging and dropping the red bar on the Data Plot to different X-axis values.
Ending the test
The test will naturally end when a termination option is triggered (end of thermal cycle, test duration elapsed, etc). At the end of the test, the output file will be downloaded to the client PC - if the client is connected - or scheduled for download with the Storage synchronization mechanism.
To forcefully stop the test, click Stop button in upper-left toolbar. You will be asked to confirm your decision, and if you want to save the partial output file or immediately delete it.
In certain conditions it is useful to stop the thermal control without stopping the test. Click the Cool button in the upper-left toolbar and confirm your decision. The confirmation dialog will warn you that, in order to stop the thermal cycle without stopping the test, the option Stop after thermal cycle was implicitly disabled. If you did not provide a maximum duration for your test, or other special termination option, it is possible that your test will never end.
Never ending tests are possible by disabling the Stop after thermal cycle option and setting a zero or negative Maximum test duration. It’s up to you to manually stop these tests.
Changing termination options has immediate effect on the running test. For example, if the thermal control ended and enable the Stop after thermal cycle option, the test will instantly stop. Or, if you set a maximum test duration greater than zero but smaller than current elapsed time.