Data Interface
This chapter offers additional information tailored at Misura™ Flash users, which might not be sufficiently covered in the general Misura™ documentation.
Flash data is organized in a highly hierarchical interface, designed to allow to both have a quick overview and dig deeper into every detail.
- For each Sample (
S), we have multiple segments or equilibrium temperatures (T): - For each Equilibrium Temperature (
T) we have multiple shots - For each shot (
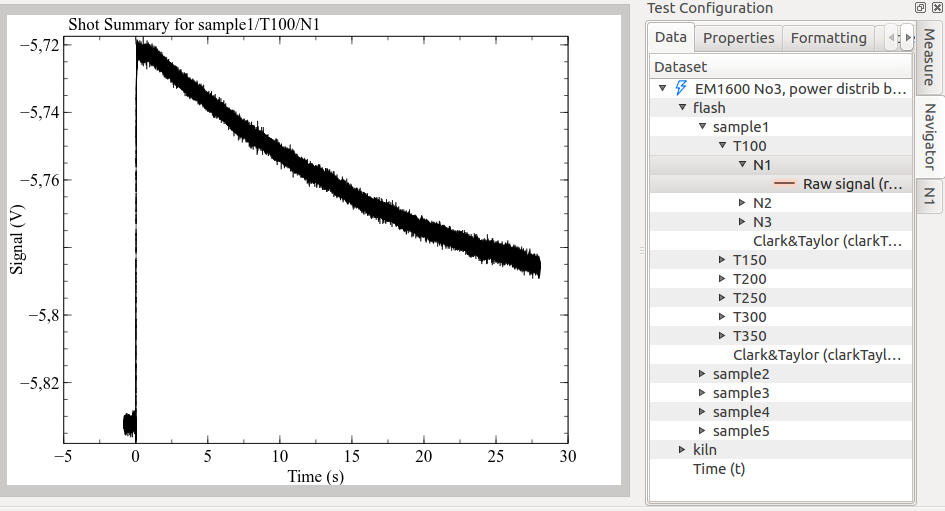
N), we have:- raw thermogram,
- laser pulse
- corrected thermogram
- one or more curve-fitting results
- Each shot can be fitted against one or more models (
M), with different model parameters each tim - For each set of model parameters we have:
- Fitting Results
- Fitting Errors
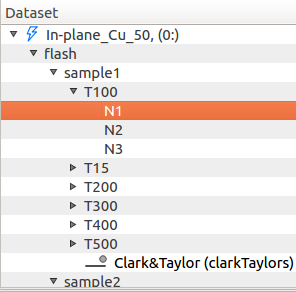
So the hierarchy is: S/T/N/M, or sample, temperature, shot, model.
This structure is represented in the Misura™ Navigator tree:
And in the global component’s panel, from :
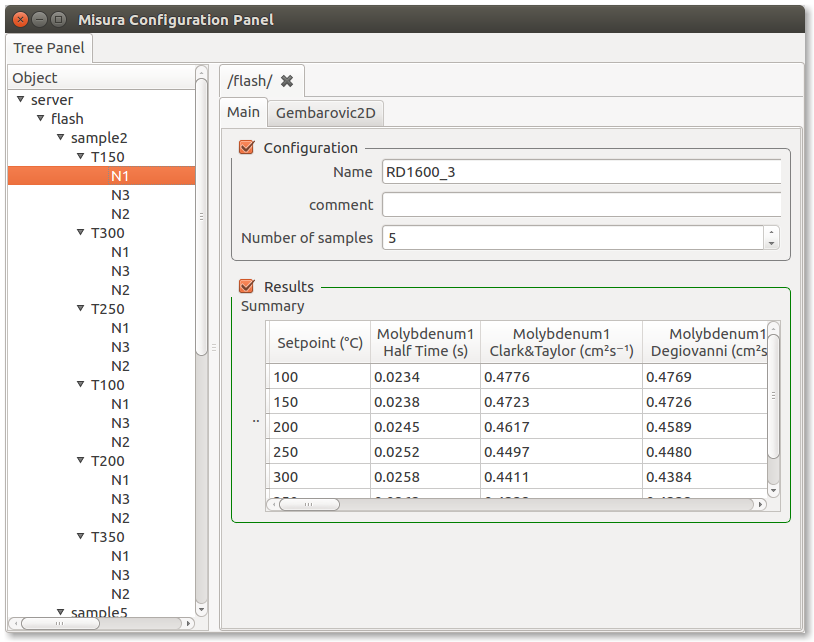
Each entry in those trees represents a component of the above hierarchy, and each component has several options representing either results or configurations.
Navigating configurations
Misura™ Flash tries to read most of the test information contained in the original test FlashLine structure, except few debug outputs.
The FlashLine configuration dialog is reported here to better understand field mapping:

This information is organized across Misura™ user interface elements. This paragraph helps locating most important metadata.
Most information is shown in the Test Configuration area.
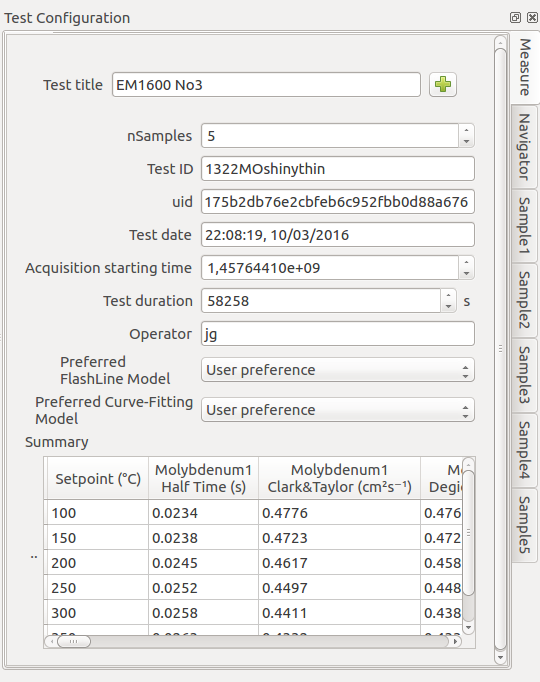
This area is divided into several tabs:
- Measure tab contains global test information - eg, not specific to a single file.
- Navigator tab contains Misura™ Navigator controls.
- Sample<N> tabs, one for each
<N>samples, contain data which is specific and potentially different for each signle sample.
Measure tab
Relevant Measure entries are explained below:
| Misura™ | FlashLine | Notes |
|---|---|---|
| Test title | Same | |
| Test ID | Same | |
| uid | None | Automatically generated by Misura™ to uniquely identify the test |
| Test date | Date | |
| Test duration | None | Total time elapsed from the start |
| Operator | Same | |
| Preferred FlashLine Model | None | The preferred diffusivity value to be displayed in plots. |
| Preferred curve-fitting model | None | The default curve-fitting model |
| Summary table | None | A table listing all diffusivities, for all temperatures and all samples |
Sample tabs
The sample tab is divided into two subsections:
- Configuration contains sample properties as entered by the user.
- Results. contains diffusivity results.
FlashLine displays sample properties in a table under the general test information. FlashLine table columns are mapped here:
| Misura™ | FlashLine column | Notes |
|---|---|---|
| Sample title | Third, namesake column | |
| Position | First, namesake column | Carousel position |
| Thickness | Fourth, namesake column | |
| Diameter | Fifth, namesake column | |
| Weight | Last, namesake column | |
| Test type | Specific Heat/Condictivity global checkbox (bottom dialog). | Not all test types can be directly mapped to a FlashLine interface element. Some of them are global (eg: equal for all samples). |
| Sample ID | Second, namesake column | |
| Expansion type | Use Expansion dialog | Type of expansion fitting function |
| Expansion reference | Use Expansion dialog | Expansion reference data |
| Diffusivity Reference | None | See Loading reference data |
| Specific Heat Reference | None | |
| Density Reference | None |
Navigating results
Configuration panels, tabs, sections, groups and options are introduced in the general Misura™ documentation about Components and options.
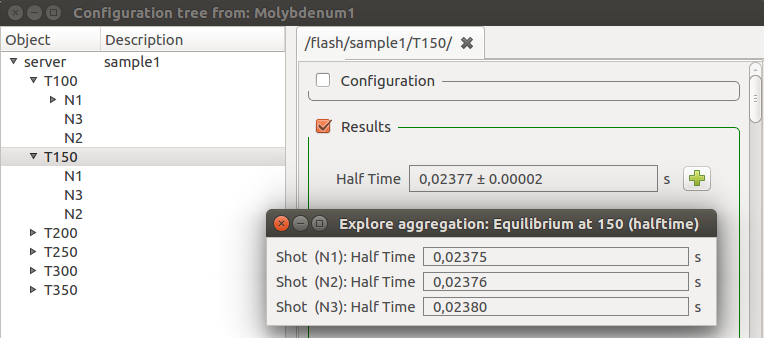
A prominent role is played by aggregates. Diffusivities and associated errors are calculated for each shot and for each model run, in the (N) and (M) nodes above. Parent nodes are informed of these results with a mechanism called option aggregation, explained in Aggregates.
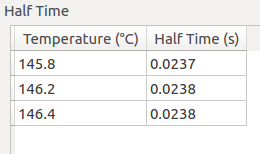
In this way, each segment node (T100) can calculate and display the mean value across diffusivities of its shots (N1, N2, N3…):
And a tabular representation, by shot temperature:
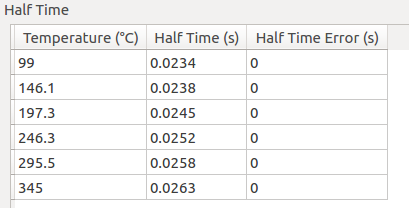
A sample (S1) can build a table with temperature-diffusivity mean from all its temperature segments (T50, T100, T150…):
And the whole test can display a global summary table containing all values, from all samples (S1, S2, S3…).

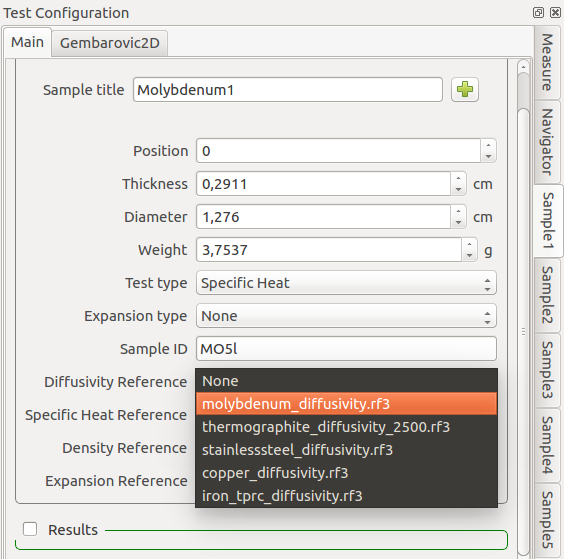
Loading reference data
Standard reference materials can be defined for each sample, in the Sample N right panel.
If all samples have the same reference, it can be defined just on time.
After a selection is made, new output tables and values will be generated in each sample, segment and shot, containing reference data.
New reference datasets will also appear in the Misura™ Navigator under the sample and segment nodes, so they can be plotted by double-clicking or right-click then Plot.
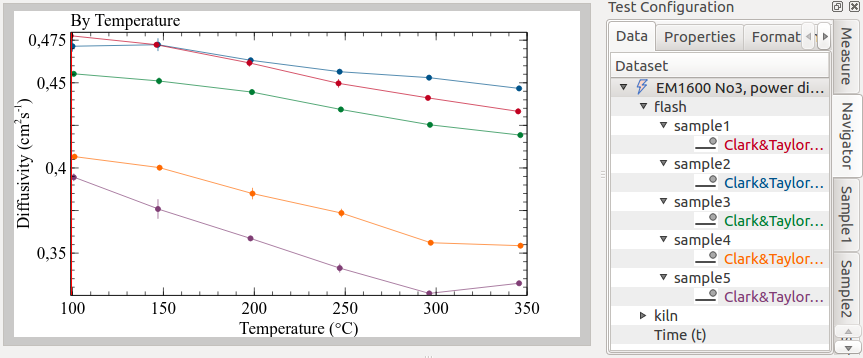
Summary Plots
When a test is opened, a summary plot will display Clark&Taylor diffusivities with temperature, for all samples. The diffusivity method can be changed by setting Preferred FlashLine Model to any supported technique.
Other summary plots can be created from the navigator, by double-clicking on supported nodes, or right-click and selecting the associated plot action.
The following animation illustrate the process of creating the default plots as hereafter explained:
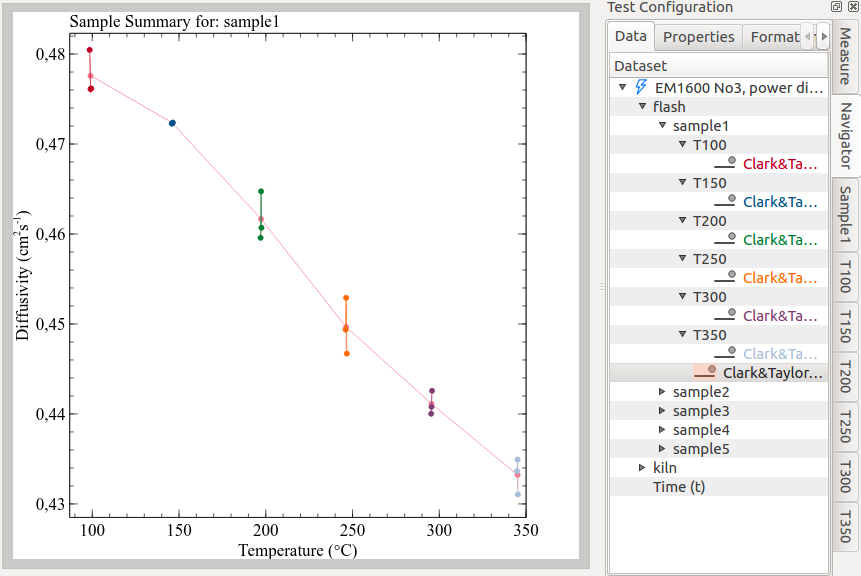
Sample Plot
By selecting Sample Plot or double-clicking on a sample node, a new plot will be created with diffusivities by temperatures of the selected sample.
It will additionally display point clouds around each mean diffusivity value, representing the diffusivity obtained from each shot.

Model Plot
Any curve-fitting model can create a Model Plot. The page is splitted in two sub-plots: the upper part shows the thermogram and model output; the lower part shows the residuals.

In case of model re-run, this model will only partially update. It is preferrable to re-create it from zero, from the action in the navigator.
Dynamic Test Configuration tabs
As the current plot changes to display data from different samples, segments and shots, the vertical tabs in the Test Configuration load relevant component’s information.
The default Summary Plots, for example, displays diffusivity curves for all samples. The Test Configuration accordingly lists one configuration tab for each sample.
A Sample Plot, plotting data from one sample and multiple segments, will show both relevant sample’s tab, and one tab for each segment.
With the same logic, Segment Plot offers the loaded segment tab plus one tab for each shot, and the Model Plot both the shot tab and the model output tab where model configuration and results are saved (for example, gembarovic).
Plots Board
Plots are organized as pages of a document. Pages can be browsed with the blue left/right arrows on the upper plot bar.
When many plots are created, navigation can become quite confusing. The Plots Board and the breadcrumbs navigator allow to view and manage plot pages in a hierarchical way.
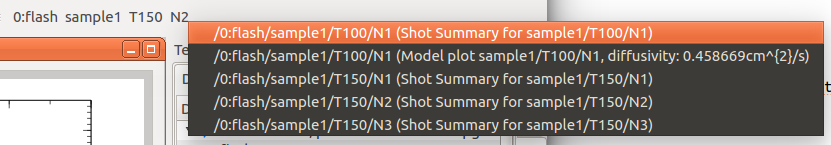
The plots board displays pages screenshots side-by-side, as a plain list. But not all pages are displayed at once: only those sharing the same hierarchical level.
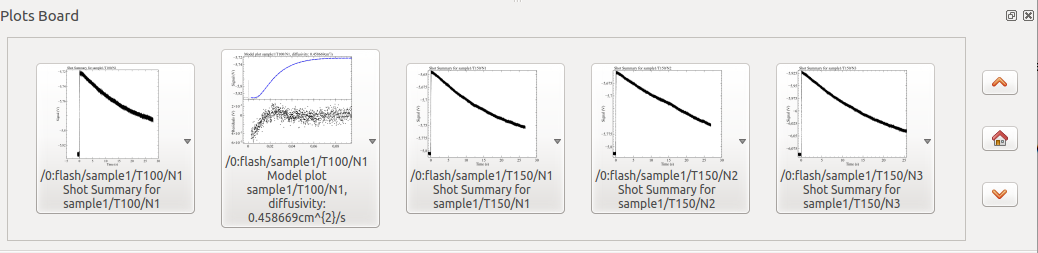
All sample plots will be listed together, as well as segment plots or shot plots, but they will never mix. The example shows numerous shot plots, and a model plot (classified at the same hierarchical level as shots).
By left-clicking on a plot screenshot, it will appear in the main plot window.
If the left mouse button is kept pressed, or with a right-click, a context menu will appear, allowing to:
- Explicitly Show (the same as single click)
- List all children: will show only plots containing curves which are dependent from those contained in this plot. For example, if only children of a sample are selected, only plots from that sample’s shots will be listed.
- Delete the plot page
- Export the page to pdf
The board also shows three buttons:
- up and down arrow, to navigate in the hierarchy levels
- home, to reset all selections and display the level corresponding to the current plot page
The following animation illustrates the plots board in action. Notice also as the Breadcrumbs updates accordingly.
Breadcrumbs
It appears as a simple sequence of labels, representing the current hierarchical level. Each label can be clicked and gives access to any other plot page in that hierarchical level.
The principle of the breadcrumbs is similar to the plots board, except that it does not include screenshots and can only switch to the selected page, with no additional actions like delete etc.